Data Analysis Pipeline
CMPT 353
Data Analysis Pipeline
Returning to the big question for the course: You get some data. Then what do you do?
The answer is long, but we can get started…
Data Analysis Pipeline
There is a common collection of steps that are necessary.
Data Analysis Pipeline
- Figure out the question.
- Find/acquire relevant data.
- Clean & prepare the data.
- Analyze the data.
- Interpret & present results.
Data Analysis Pipeline
People starting data science usually imagine spending their time in analyze the data.
The reality: it's not unusual to spend 90% of the time and effort on the other steps, especially cleaning.
Your Question
Remember this?
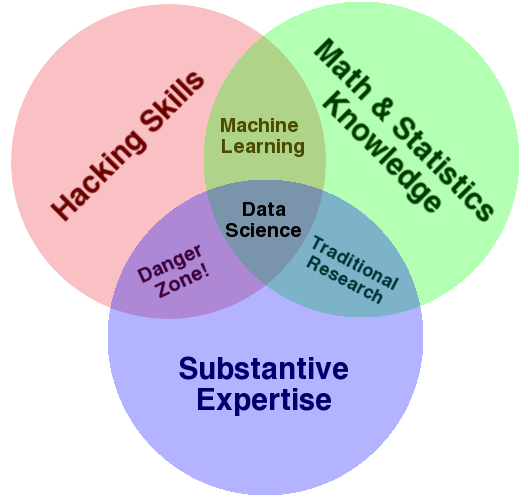
Your Question
Refining and understanding the question often falls into the substantive expertise
category: you have to know the problem domain to understand what question is being asked, and how it must be answered.
Your Question
e.g. The seemingly well-formed question how many of our students have a GPA below 2.4?
- Who are
our students
? CMPT majors? Any CMPT program? Anyone taking many CMPT courses? Anyone who sees FAS advisors? - Who is an SFU student? Taking courses right now? Taking courses in the last 3 semesters? Anybody not flagged
withdrawn
orgraduated
? - Which GPA? Cumulative? Last semester? Upper division?
- ⋮
Your Question
Practical reality: we won't be spending much time on interpreting the question.
I'll try to stick with problem domains you understand, or are easy to figure out.
Getting Data
Sometimes you'll be handed the perfect data to answer your question.
Sometimes you'll have to find it.
Sometimes you'll have to collect it.
Sometimes you'll have to give the best answer you can with imperfect data.
Getting Data
There are many ways you might get the data you need into your program.
- Files you have: CSV, Excel, XML, text, …
- An API (i.e. fetching URLs) of JSON, XML, HTML, …
- A database (SQL and friends).
- A sensor/instrument collecting data.
- ⋮
More later.
Preparing Data
Just because you have data
doesn't mean it's the data you need. It's very common to have data arrive with…
- piles of extra stuff you don't actually need.
- different units for similar values (e.g. lb, g, kg).
- different identifiers (
SFU
==Simon Fraser University
==Simon Fraser
?). - different formats in different files (e.g. some CSVs have an extra column).
- shaped wrong: columns vs rows, normalized (or not).
Preparing Data
It's also possible to have data
that isn't as correct as you might like. You can have…
- missing values (failed sensor, incomplete collection, etc),
- outliers (because of data entry error, or incorrect data gathering, or …),
- noise (because sensors aren't perfect).
Preparing Data
Getting the data you found into the form you need can be a huge amount of work.
We will talk about some common techniques, but it's often just a lot of work + programming + manual repair.
Analyzing Data
This is the part you thought you'd spend a lot of time doing.
The question here: how do you take the data, and get out the answers you want?
Analyzing Data
There are many ways to analyze data to get answers.
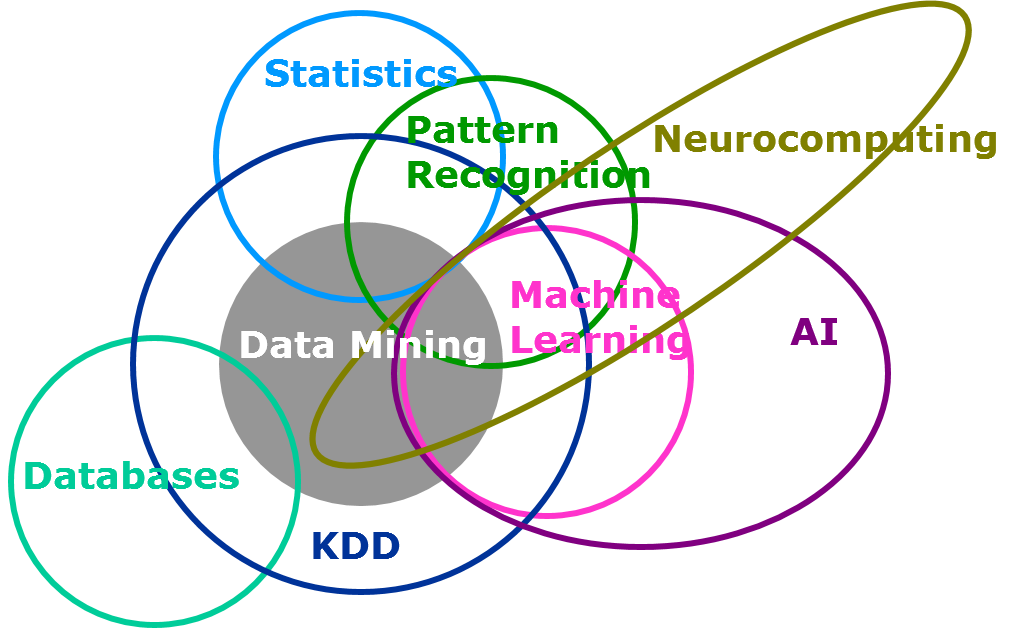
Figure from SAS, data mining, and machine learning.
Analyzing Data
We will focus on inferential statistics and machine learning.
That leaves out some important techniques, but it's a good place to start.
Presenting Results
Analysis results aren't much use if you don't know what they mean or tell anybody about them. It's not always easy to (correctly) interpret results, or explain them to others.
Presenting Results
This is another question best addressed by another course. We will talk a little about it.
Creating a Pipeline
The full data analysis is often broken up into many steps.
These could be separate functions in a single program that does the whole thing.
This is often impractical: calls remote API every time you test it; test runs might be time-prohibitive; intermediate results might be meaningful to examine.
Creating a Pipeline
Maybe separate programs for each step (or collection of steps)?
Re-running takes more work. Looks a little sloppy.
Creating a Pipeline
A well-structured pipeline could be as simple as organizing your code well.
01-scrape-data.py
02-clean-missing-fields.py
03-generate-features.py
04-train-model.py
05-score-model.py
06-generate-plots.py
Creating a Pipeline
Or for big jobs with shared data and/or code, it might be easier to do something like:
if phase == 1:
    ⋮
    d1.write.parquet("data1")
elif phase == 2:
    d1 = spark.read.parquet("data1")
    ⋮
    d2.write.json("data2")
elif phase == 3:
    d2 = pd.read.json("data2")
    ⋮
Creating a Pipeline
It's sometimes preferable to have a very interactive way to experiment with your data. Usually called a notebook.
Ones you may have used/heard of: Matlab, Maple, R-Studio, most stats programs.
With Python (and other languages), Jupyter (formerly iPython Notebook
) is very useful.
Creating a Pipeline
For this course, I will ask for some combination of these. Always using the same one would be dishonest.
Manual Pipeline Steps
There are perfectly good reasons to have a manual step in the pipeline
.
Some analysis may be best performed by a person and manually entered before running step \(n+1\).
Manual Pipeline Steps
Maybe a step would take 10 minutes to do by hand, or hours to automate.
Maybe it's easy to automatically calculate in 90% of the cases, leaving 10% don't know
for manual intervention.
In this course, we'll automate. In reality, it's not always obvious what's easiest.
The Pipeline
The data pipeline
isn't always obvious: it's easy to end up with several somewhat-related programs that need to be run a certain way to get answers.
My suggestion: remember that you're creating some kind of workflow for your data. Organize your code so you can easily document/remember how to get things done.
Don't forget the document
part.